UI Overview
Tab bar
The tab bar runs across the top. Each tab is a self-contained workspace. The app opens on the Management tab; the order below is the tab-bar order.
| Tab | Purpose |
|---|---|
| Visualization | Linked scatter plots, histograms, and 3D molecule viewer for exploring the loaded dataset |
| Management | Load, stage, merge, and export molecular datasets |
| 3D molecule generation | Run pretrained diffusion models to generate novel 3D molecules |
| Structure-directed generation | Complete or extend an existing structure using a reference scaffold |
| Analysis tools | Enrich the dataset with quantum-chemistry calculations, fingerprints, and 2D layout coordinates |
| Model training | Configure and queue MolCraftDiffusion training jobs |
| Plug-in tools | Run custom external scoring functions or predictors |
Workspace overview
The interface is organized into task-specific workspaces for Management, Visualization, 3D molecule generation, Structure-directed generation, Analysis tools, Model training, and Plug-in tools, which together cover the main stages of a 3D molecular design workflow.
How the tabs connect
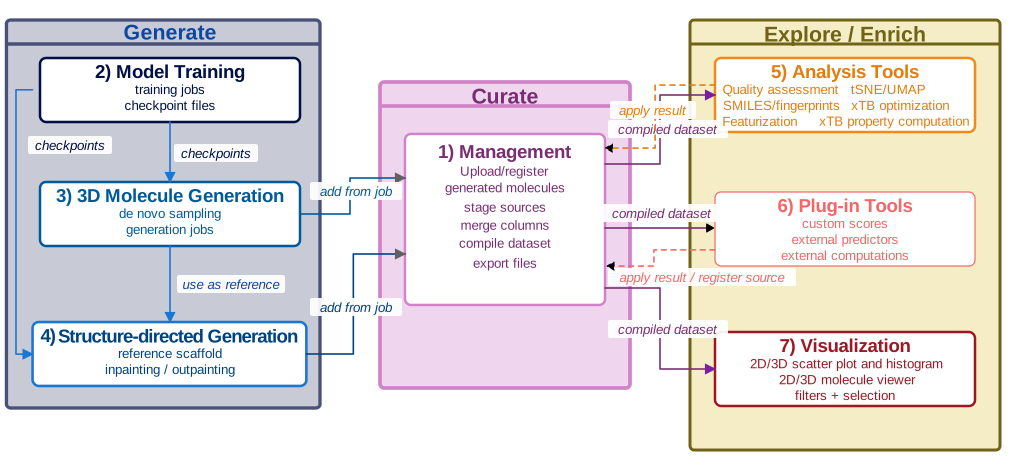
flowchart LR
    classDef gen   fill:#6366f1,stroke:#4338ca,color:#fff,font-weight:bold
    classDef cur   fill:#0ea5e9,stroke:#0284c7,color:#fff,font-weight:bold
    classDef exp   fill:#10b981,stroke:#059669,color:#fff,font-weight:bold

    subgraph GENERATE["Generate"]
        MT("Model training")
        GEN("3D molecule generation")
        SG("Structure-directed generation")
    end

    subgraph CURATE["Curate"]
        MG("Management")
    end

    subgraph EXPLORE["Explore"]
        AT("Analysis tools")
        PT("Plug-in tools")
        VIZ("Visualization")
    end

    MT -- "checkpoints" --> GEN
    MT -- "checkpoints" --> SG
    GEN -- "Use as ref" --> SG
    GEN -- "Register generated molecules" --> MG
    SG -- "Register generated molecules" --> MG
    MG -- "compiled dataset" --> AT
    MG -- "compiled dataset" --> PT
    MG -- "compiled dataset" --> VIZ
    AT -- "Apply results" --> MG
    PT -- "Apply results" --> MG

    class MT,GEN,SG gen
    class MG cur
    class AT,PT,VIZ exp
The central hub is Management: generation outputs flow into it, analysis tools enrich it, and Visualization reads from it. Model training produces the checkpoint files that power both generation tabs.
Keyboard shortcuts
| Key | Action |
|---|---|
1–7 |
Switch to the corresponding tab (tab-bar order above) |
? |
Show / hide the keyboard-shortcuts overlay |
Esc |
Close dialogs and overlays |
Shift+Enter |
Submit a generation job (generation tabs only) |
Number shortcuts are ignored while a text field is focused.
Top bar
The theme selector (top-right) cycles through six visual themes (Cosmos, Arctic, Neon Bio, Amber Lab, EPFL, Arcane Study). The choice is saved to browser local storage.
Toast notifications
Brief status messages (errors, confirmations) appear as overlay toasts and dismiss automatically.
Dataset state
The currently loaded dataset is shared across all tabs. Loading a new dataset or compiling in Management updates what Visualization and Analysis tools see.